Description
Features:
- Automatic Trendlines – this will save you lots of time, using proven concepts by implementing TD Points level 1 – 3.
- Signals on qualified Trendline-Breaks – this will make your signals super-reliable, following strict rules/ multiple conditions
- Different types/combinations of Stop Loss, Trailing Stops and Take Profit settings
- TP/SL based on R:R (1:1 to 1:10)
- TP/SL based on the Three Day Trailing Stop Rule (3DTSR) from Peter Brandt
- Combinations of both, R:R and 3DTSR
- RSI Filter – this will make your signals even more reliable because the filter adds an extra confirmation to the signals.
- Alert Conditions – Just set up your alerts and then there is no need to wait in front of your computer. Never miss a profitable trading opportunity.
- Create your personal Crypto-Trading-Bot with autoviewand the TD Lines Study
What’s included:
- TD Lines Study (generate signals)
- TD Lines Strategy (backtest your settings)
- BONUS: A “free” version of autoview. License-checks are disabled – all Crypto-Exchanges can be used – unlimited!

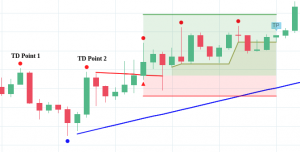 The setup shown here is: TD Points level 3, Taking Profit via R:R 1:3, combined with 3DTSR trailing Stops.
The red Trendline (it is a TD Supply Line) is automatically drawn via continuing the invisible Line that connects TD Points 1 and 2 (these are Level 3 TD Supply Points).
At the red Triangle, a qualified Trendline-Break occurs and a Buy-Signal is fired.
The red and green areas visualize the TP and SL Levels. The olive area appears, when the Trailing Stop Rules kick-in.

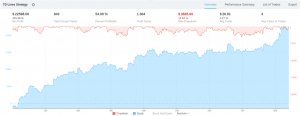 The Screenshot to the Right shows the backtesting Results of XAUUSD on a 1H Chart. The Drawdown seems to be too high, but the Net-Profit is amazing!

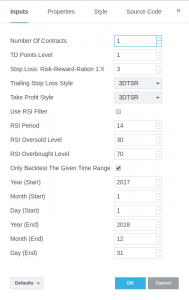 This is the Properties Dialog, showing the Settings for the above backtesting example.