TradingView has a nice feature to add alerts based on some conditions. You could setup an alert, whenever price reaches a certain level or when price crosses an indicator that is available on the current chart.You get an email alert or a pop-up notification each time certain market conditions are met, so you can check the chart and decide to take a trader or not.Maybe you want to get notified if price is above a moving average, so you can check the chart and see if there is potential that price will move back.But usually buy and sell signals are more complex and combine multiple conditions. If your strategy looks like this: “create a buy signal if price is below the moving average and RSI is below 30”, you could setup two alerts – one for the moving average and one for RSI. If both alerts are triggered at almost the same time, you could decide to take the trade. But you would always need to monitor your alert messages and check if there are related conditions that will make up your buy/ sell signal in combination. This can become very confusing, especially if you consider to add more conditions to your strategy. Sadly currently there is no out-of-the-box option to create one alert that combines multiple conditions. But luckily you can solve the problem with very few lines of PineScript code.Just open the Pine editor with a blank indicator script and insert the following script:
| //@version=2 |
| study(“RSI+MA”, overlay=true) |
| // data series for RSI with length 14 |
| rsi = rsi(close, 14) |
| // data series for Moving Average with length 9 |
| ma = sma(close, 9) |
| // data series for buy signals: |
| //price should be below the moving average and RSI should be smaller than 40 |
| buy_signals = close < ma and rsi < 30 |
| // data series for sell signals: |
| //price should be above the moving average and RSI should be above 60 |
| sell_signals = close > ma and rsi > 70 |
| // draw some shapes on the chart if conditions are met |
| plotshape(buy_signals, style=shape.triangleup, text=”up”) |
| plotshape(sell_signals, style=shape.triangledown, text=”down”) |
| // create alert conditions so that alerts can be create via the add alerts dialog |
| alertcondition(buy_signals, title=’Buy-Signal’, message=’price is below the MA and RSI is below 40′) |
| alertcondition(sell_signals, title=’Sell-Signal’, message=’price is above the MA and RSI is above 60′) |
view rawRSI+MA.js hosted with ❤ by GitHub
This indicator will plot up- and downward-pointing triangles, whenever the buy-/ sell-conditions are met.
In line 5 and 7, data series are created for the indicators you would like to use. For the sake of clarity, the length of the RSI and MA are hardcoded but could also be provided by an input dialog.
The conditions that implement the strategy are implemented in line 11 and 15. The RSI treshold is hardcoded as well.
To have a visual representation of the signals, we will plot triangles, see line 18 and 19.
To not only see the signals on the chart, but to get the opportunity to create alerts, we need to introduce alertconditions in line 22 and 23.
And that’s it – click on the “Add to chart” button and see how the triangles are plotted to the chart:
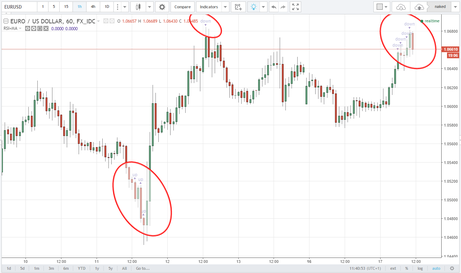
As you can see on this EURUSD 1H chart, there are some promising signals based on this very basic strategy of just combining RSI and MA.
The next step is to setup the alerts, so you get notified while you are on the go.
The next step is to setup the alerts, so you get notified while you are on the go. To do this, open the “Add Alert” dialog.
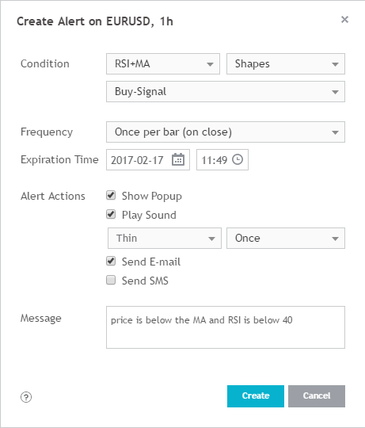
The default condition for alerts is always based on the price of the current financial instrument, so be sure to select the newly created indicator “RSI+MA” instead of “EURUSD”.
The indicator script implemented two alert conditions, one for buy-signals and one for sell-signals. So we need to setup two alerts, if we want signals for both directions.
Finally you just need to configure the frequency and the alert actions and maybe you want to customize the alert message text – everything is quite self-explanatory.