 Facebook’s announcement of plans to launch a digital currency, earlier this summer, set in motion a full-blown turf war in global finance. The statement from Silicon Valley is that the digital currency is supplementary to bringing the world closer together through social networks.
Facebook has two significant advantages over traditional banks. Not only can it process transactions at a much lower cost, but also it already has billions of users on its platforms. Talk about an untapped market.
However, living up to that mission has been stymied by several factors. For one, the Libra cryptocurrency project is in the middle of existential threats from world leaders and central banks whose primary concerns are Libra’s potential to be used for clandestine financial activities. The nature of Libra and the scale on which it will operate makes it the perfect mule for money laundering. Stakeholders are also worried about the threat Libra poses to global financial stability and data privacy abuse, which culminates in economic privatization by some of the largest companies in the world.
As Mark Zuckerberg tries to quell this crisis, several high-profile companies that collaborated in the project, known as the Libra Association, have pulled out in a manner that is typical of the need for self-preservation. These included PayPal, eBay, Visa, and MasterCard. The backing by these financial giants gives Libra its credibility and is perhaps the biggest threat to centralized economies. The remaining financial firms and mainstream companies in this project are just not enough to stop Libra’s lose in credibility.
 The last straw that broke Libra’s back was when the G7 group of the world’s most powerful nations warned that digital currencies such as Libra pose challenges for competition and antitrust policies and should not be allowed to launch until every regulatory concern has been addressed.
As the US House of Representatives mounts pressure on Libra, Cambridge Analytica is still fresh in stakeholders’ minds. Politicians, activists and central banks have raised questions over data privacy and Facebook’s possible monopoly of a huge database of personal information. With these questions, there is no doubt that Facebook has lost bragging rights to build a digital currency, especially when it has failed to protect sensitive data in the Cambridge Analytica scandal.
Although the Bank of England is open-minded about new technology for financial transactions, it has been vocal about the need for worldwide heavy regulation of Libra. It has also maintained that Libra would need to meet the highest standards of fiat regulation – if Facebook’s dream would survive.
Although Libra would have high-tech competitive advantages that would make it quicker and cheaper, building a payment system that meets central banks’ regulations will no doubt drive the project into the ground in no time. It would be the perfect fall from grace to grass. With 2.45 billion active Facebook users, Libra could literally shift the global financial system overnight.
This has caused governments and central banks around the world to worry about the loss in control of their monetary policy if Libra handles significant financial activities. The potential shift poses a threat to national sovereignty. Besides, the “deploy—test—improve” approach typical of Silicon Valley companies is incompatible with a financial project as big as Libra.
If Facebook can satisfy politicians, central bankers, and activists over their concerns, no doubt, financial exclusion especially in developing and authoritarian countries can be history overnight. In addition, the ability of the digital currency to bypass expensive cross-border payments will save individuals and small-scale businesses money and time – thus improving personal profit margins and national GDPs exponentially.
Author: Stefan Krecher
The Risk Factor: Bitcoin vs. Gold Investment

Cryptocurrency is volatile – more than stocks, bonds, or any other familiar investment. The value of
bitcoin can go up by 25% in one hour, and it could crash in the next hour or so.
The value of bitcoin is stabilizing, give some time, and we should see a stable price chart. However,
this hasn’t been the case so far. The digital currency is relatively new. With all its hype, bitcoin
hasn’t shown the signs of being a “security asset.” You cannot trust bitcoin for the next financial
crisis.
Reviewing the Data
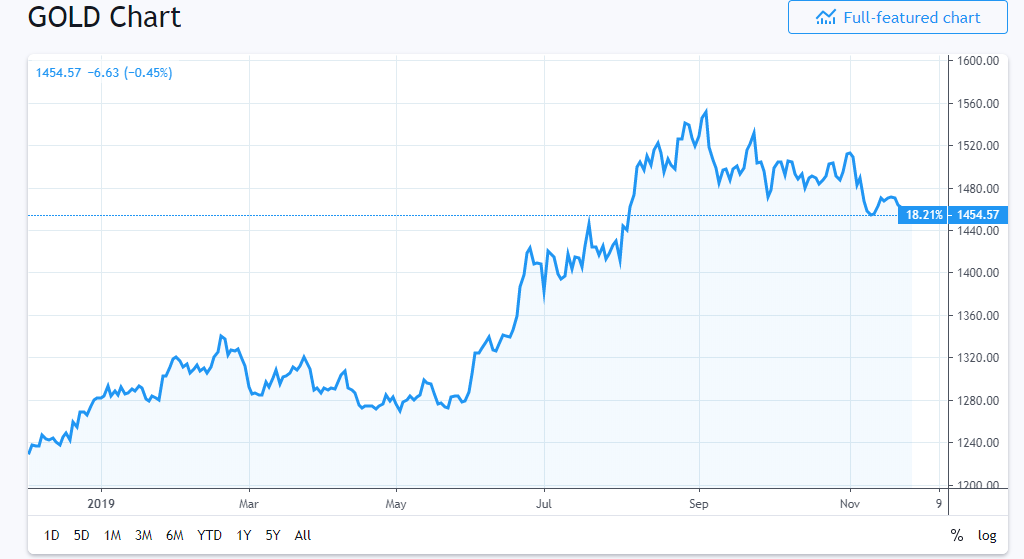
Gold price rises according to a decrease in the US dollar. That’s a trend we have seen for a long time.
Compared to that, bitcoin has moved positively, and negatively with gold charts. Consider the
recent depreciation in Chinese Yuan. The stock market fell, and gold went to an all-time high in
2019 ($1,510). Following the same pattern, bitcoin went to the all-month high to $12,325 from
$9,900.
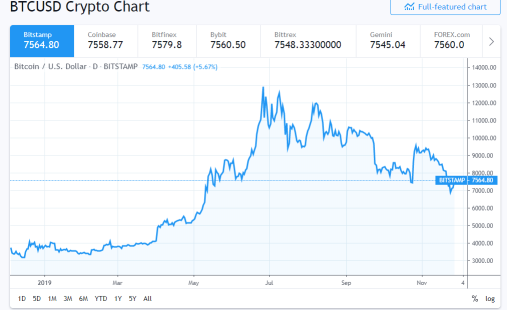
However, the charts have also moved in different directions. Until (Nov. 2018) bitcoin was being
traded at $6,000. Prices went down significantly, and by the mid of December, bitcoin was selling at
$3,000. Interestingly, in the same timeframe, gold moved from $1,200 to $1,300.
Bitcoin and gold don’t have same pricing patterns. One thing that gives bitcoin an edge is that it is a
payment network, and that alone has a considerable value. However, the numbers are changing,
and we still have to see whether bitcoin can be ‘safe haven.’
Resources:
https://www.tradingview.com/symbols/BTCUSD/
https://www.coindesk.com/bitcoin-and-gold-prices-diverge-again-extending-5-month-correlation
https://www.tradingview.com/symbols/TVC-GOLD/
https://www.coindesk.com/bitcoin-outshines-gold-amid-risk-aversion-in-financial-markets

Find profitable Divergences with TradingView
If you haven’t done yet – head over to TradingView and create an account.
Divergences are a great way to find out if the current trend is about to reverse – this very short video will show you how to manually find Divergences with TradingView.
If you need a more advanced way to detect Divergences, sou should check my Product: AutoDivergence
AutoDivergence Updates
In the past couple of months, I took the time to work on my existing products and I made some major and minor improvements.
The most exciting thing is that I finally managed to merge all my divergence-based products into one single Study/ Strategy: AutoDivergence.
This strategy now includes JeddingenDivergence v4, CCIDivergence and MACDDivergence. I also implemented a “classic visualization”, so you can use AutoDivergence in the same way a lot of you have been using CCIDivergence for manual technical analysis.
But of course all the other products have been improved too and all of them include detailed documentation on how to set up and use the Strategies.
And last but not least: I lowered the monthly subscription fees: all of my products are available for only $9.90/ month with monthly cancellation possible – no Strings attached!
have a look at this short video about AutoDivergence: Video on AutoDivergence
High profit – low Drawdown: Riding Trends with AutoTrendTrader
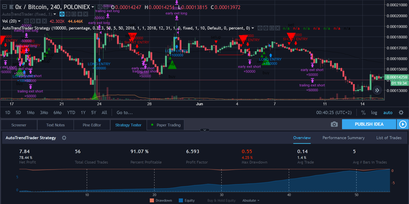
With my new Strategy, the AutoTrendTrader, you’ll receive a powerful Tool to identify strong Trends.
If you take some time to optimize the Settings, you have the Opportunity to find a Setup that is really mindblowing.
I found such a highly profitable Setup for ZRXBTC on the 4H Timeframe. You’ll get only a few Signals per Month, but according to the Backtests, more than 90% of the Trades are profitable.
Sounds almost too good to be true? But it’s getting better: Depending on your Account-size and the Position-sizes you are using, you’ll achieve almost 80% Net Profit with less than 5% Drawdown!
I’ve been using the AutoTrendTrader on the 5 Minute Chart with Autoview to automate my Trades – and this works pretty good. I wanted those instant Gratifications and the Kick you’ll get when you’re Trading on shorter Timeframes. But Riding strong Trends can be more profitable and less risky – but it takes Time and Patience.
Maybe you’ll give it a Try?
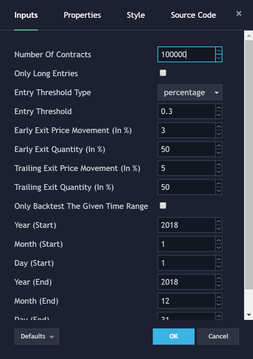
See below the Settings I’ve been using for this profitable Setup.
Five Steps to build a Crypto Trading Bot

Due to their high volatility, Cryptocurrencies are a perfect fit for algorithmic, automated – or as some might call it – robotic trading.There are different types of Crypto Trading Bots available, free and commercial ones. Using TradingView as a platform to develop, backtest and execute strategies that generate buy-/ sell signals has some major benefits – and this article should get you an Overview on the Architecture:
- TradingView can be used free, although paid plans do have some useful benefits/ features
- TradingView is web-based – Strategies can be developed and backtested in a Browser
- You can use lot’s of free strategies or buy/ subscribe to commercial ones
- You can implement your own strategies by using PineScript – there are lots of Documentations and Examples out there
There’s one thing that’s still not possible with TradingView and that’s executing trades based on your own scripts. But there is a workaround – it is a Chrome-Extension called Autoview. Autoview is an interface to some Crypto-Exchanges and a Forex-Broker. This is the List of Exchanges/ Brokers that are currently supported: 1Broker, Binance, BitMEX, Bittrex, OKCoin and Poloniex.Trade-Execution will be triggered by TradingView alerts.It would be a good Idea to install Google-Chrome on a VPS (Virtual Private Server), install the Autoview Extension and login into your TradingView account, but of course you can start playing around with Autoview on your Laptop.To get your feet wet with algorithmic/ automated Trading, go ahead and do the following Steps:
- Subscribe to TradingView by following this link. There is one pitfall with the free plan: you can only create one Alert while the most Strategies need at least two Alerts – one for Entry-Signals and one for the Exits. In a later Blog-Post I will describe a fully automated approach that needs only one Alert but for now you should use an advanced TradingView plan with a free Trial.
- Create a free Account at the Bitmex-Testnet – as far as I know Bitmex is the only Exchange that is supported by Autoview that supports Paper-Trading. Go to the Account-Settings, Submenu “API Keys”, create an API Key and save the Key somewhere so you can copy-paste it to your Autoview-Settings later. The most popular Symbol traded on Bitmex is XBTUSD which is a perpetual contract based on Bitcoin/ BTC. You can trade long or short and trade on Margin/ use Leverage. Other Symbols like Ethereum (ETH), Cardano (ADA), Bitcoin Cash (BCH), Litecoin (LTC) and Ripple (XRP) are available too. If you intend to create a Live-Trading Account at Bitmex, you would do me a favor when you use this affiliate link.
- Assuming that you are already using Google Chrome (if not, get the Browser here), install the Autoview Extension, configure the Extension to use your Bitmex-Testnet Account by pasting the API Key, and make yourself familiar with the Alert-Syntax. You will use the Alert-Syntax to create Commands that will be executed each time an Alert is triggered.
- Do the hard Work: Pick a Strategy that has a Study-counterpart that both were made to be used with Autoview. You can go to the TradingView search-bar, chose to search for scripts and search for the keyword “autoview”. Or you can read the Autoview Documentation – there are a lot of tutorials and links to free Strategies/ Studies. Of course you could just subscribe to one of my Products – all of them are ready to be used with autoview, but starting with a free one by using the Bitmex-Textnet is a reasonable way to start your path to algorithmic Trading.
- Finally, if you picked a Study – create your Alerts as described in the Autoview Documentation to see if your configuration works and Trades go through the System. Maybe you start Trading on lower Timeframes to generate a lot of Signals. If Everything works and you understood what’s going on, it’s Time to optimize your Settings.
I will go into more Details later but this is a kind-of Quickstart Guide that gave you an Overview on how things are connected.If you have Questions, feel free to contact me via Email, Skype (stefan.krecher), TradingView-private Message (Trader stefcom) or fill out the Form on my Contact Page.
Create alerts with multiple conditions
TradingView has a nice feature to add alerts based on some conditions. You could setup an alert, whenever price reaches a certain level or when price crosses an indicator that is available on the current chart.You get an email alert or a pop-up notification each time certain market conditions are met, so you can check the chart and decide to take a trader or not.Maybe you want to get notified if price is above a moving average, so you can check the chart and see if there is potential that price will move back.But usually buy and sell signals are more complex and combine multiple conditions. If your strategy looks like this: “create a buy signal if price is below the moving average and RSI is below 30”, you could setup two alerts – one for the moving average and one for RSI. If both alerts are triggered at almost the same time, you could decide to take the trade. But you would always need to monitor your alert messages and check if there are related conditions that will make up your buy/ sell signal in combination. This can become very confusing, especially if you consider to add more conditions to your strategy. Sadly currently there is no out-of-the-box option to create one alert that combines multiple conditions. But luckily you can solve the problem with very few lines of PineScript code.Just open the Pine editor with a blank indicator script and insert the following script:
| //@version=2 |
| study(“RSI+MA”, overlay=true) |
| // data series for RSI with length 14 |
| rsi = rsi(close, 14) |
| // data series for Moving Average with length 9 |
| ma = sma(close, 9) |
| // data series for buy signals: |
| //price should be below the moving average and RSI should be smaller than 40 |
| buy_signals = close < ma and rsi < 30 |
| // data series for sell signals: |
| //price should be above the moving average and RSI should be above 60 |
| sell_signals = close > ma and rsi > 70 |
| // draw some shapes on the chart if conditions are met |
| plotshape(buy_signals, style=shape.triangleup, text=”up”) |
| plotshape(sell_signals, style=shape.triangledown, text=”down”) |
| // create alert conditions so that alerts can be create via the add alerts dialog |
| alertcondition(buy_signals, title=’Buy-Signal’, message=’price is below the MA and RSI is below 40′) |
| alertcondition(sell_signals, title=’Sell-Signal’, message=’price is above the MA and RSI is above 60′) |
view rawRSI+MA.js hosted with ❤ by GitHub
This indicator will plot up- and downward-pointing triangles, whenever the buy-/ sell-conditions are met.
In line 5 and 7, data series are created for the indicators you would like to use. For the sake of clarity, the length of the RSI and MA are hardcoded but could also be provided by an input dialog.
The conditions that implement the strategy are implemented in line 11 and 15. The RSI treshold is hardcoded as well.
To have a visual representation of the signals, we will plot triangles, see line 18 and 19.
To not only see the signals on the chart, but to get the opportunity to create alerts, we need to introduce alertconditions in line 22 and 23.
And that’s it – click on the “Add to chart” button and see how the triangles are plotted to the chart:
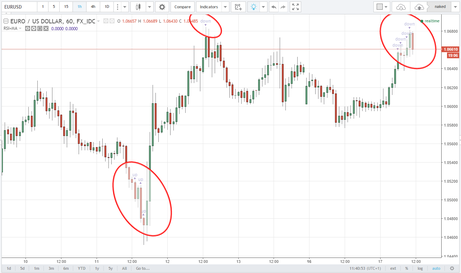
As you can see on this EURUSD 1H chart, there are some promising signals based on this very basic strategy of just combining RSI and MA.
The next step is to setup the alerts, so you get notified while you are on the go.
The next step is to setup the alerts, so you get notified while you are on the go. To do this, open the “Add Alert” dialog.
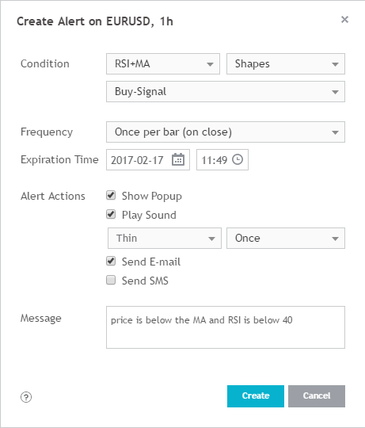
The default condition for alerts is always based on the price of the current financial instrument, so be sure to select the newly created indicator “RSI+MA” instead of “EURUSD”.
The indicator script implemented two alert conditions, one for buy-signals and one for sell-signals. So we need to setup two alerts, if we want signals for both directions.
Finally you just need to configure the frequency and the alert actions and maybe you want to customize the alert message text – everything is quite self-explanatory.